

In conventional seismic sections the amplitudes are associated with boundaries between geological formations, such as the top/base reservoir. This data is well suited for structural interpretation. In an inverted dataset, the amplitudes describe the internal rock properties, such as lithology, porosity or the fluid type.
Inverted data is ideal for stratigraphic interpretation and reservoir characterization.
Depending on a client’s needs, Sterling can produce post stack, pre stack or stochastic inversion products. Sterling uses a unique inversion workflow which incorporates both well data and seismic processing velocities in building the model for inversion. Our specialist on one end works closely with processing to ensure the gathers are suitably conditioned for inversion and on the other end works with clients to ensure their needs are matched with the data provided.
A wells-only background model can be built to derive the coefficients necessary to invert the seismic data to realistic values of P-Impedance, S-Impedance, and density that match the Zp, Zs, and density well logs filtered to the seismic frequency band. The issue with the wells-only background model is that the low-frequency component is interpolated between the wells using the seismic horizons as a guide. There is no other geological information that goes into the background model. If the seismic velocity field correlates with the P-wave velocity field filtered to the seismic interval velocity bandwidth, we can, in addition to the wells, use the seismic velocity field to build the background models for Zp, Zs, and density. Though time consuming, we believe the results are superior to inversion with wells-only background models.
Typical deliverables.
Once the inversion is complete, post-inversion attributes, such as Young’s modulus, Poisson’s ratio, lambda-rho, mu-rho, closure stress and others can be calculated from the inverted Zp, Zs, and density. In addition, as part of the workflow Sterling routinely includes reservoir characterization work involving additional seismic interpretation to complete interval of interests, detailed facie classification crossplots, and maps providing additional information about rock properties such as lithology, porosity, ductile-brittle behavior, etc.
Having seismic well tie (synthetic) control is important, but having seismic that predicts rock properties is even better!
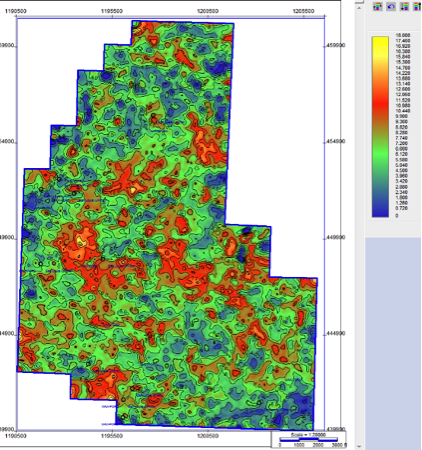
Porosity map – Interval of interest Porosity cut off > 5 %
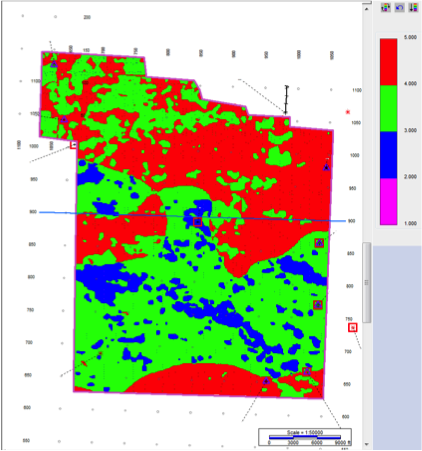
Combination map – Interval of interest Porosity/TOC/Brittleness/DFI
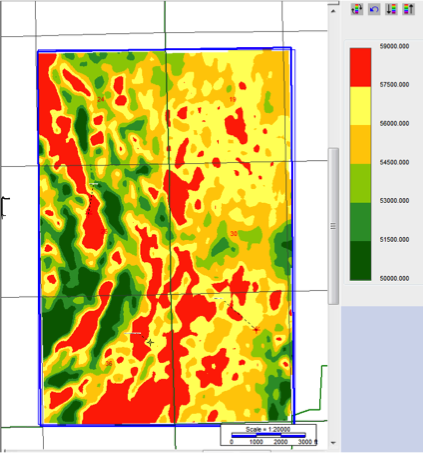
Depth Acoustic impedance map
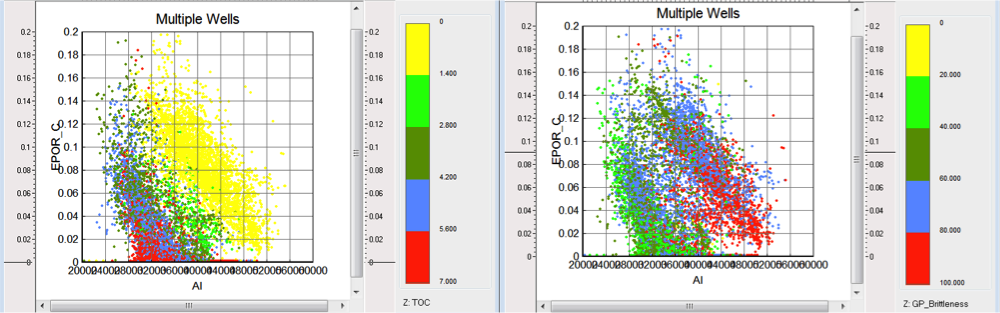
Facie Classification. AI vs. Porosity color coded by TOC and Brittleness