

Sterling Seismic & Reservoir Services VSP Survey Design, Processing and Analysis
Sterling Seismic now offers a full suite of VSP services – both conventional 3-component geophone and DAS data. These services include the design and planning of all forms of VSP survey geometries (e.g. ZVSP, 2D VSP, 3D VSP and time-lapse 4D VSP) as well as the processing, imaging and analysis for all types of applications. Our highly experienced staff includes Richard Van Dok and Brian Fuller, both with many years of surface seismic and VSP processing experience.
VSP Survey Design
Sterling uses OMNI™ design software to model and design all forms of borehole seismic surveys. This package offers 3D ray tracing to estimate the illumination possible at the target zones of interest. In addition, Sterling has access to the VizPRO ray tracing software that will allow ray tracing through complex 3D anisotropic velocity models, including mode-converted S-wave reflections.
For more advanced studies, Sterling offers both 2D and 3D finite-difference acoustic and elastic modeling tools to estimate the recorded wavefield for any survey geometry.
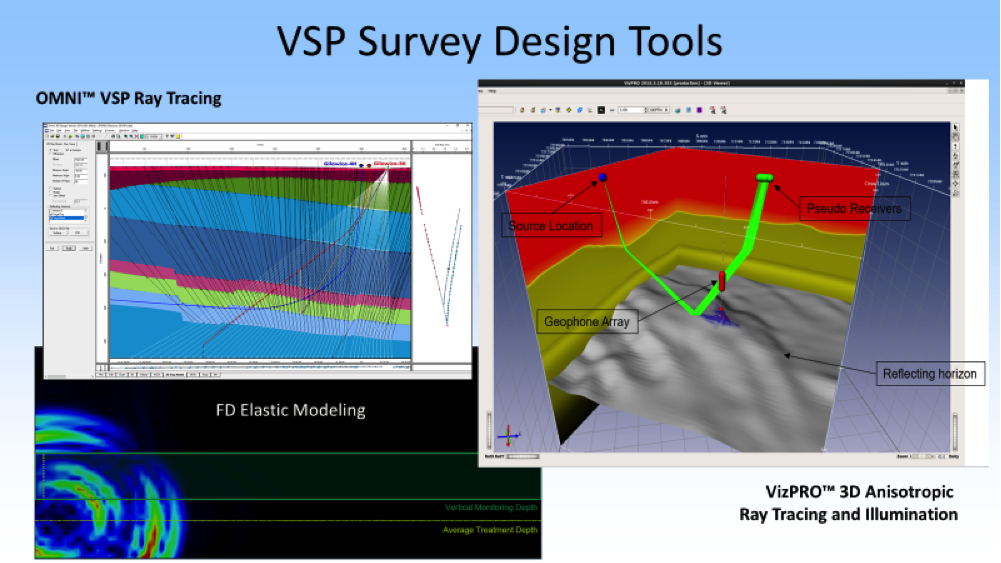
Figure 1: VSP survey modeling tools available at Sterling
Zero-Offset VSP Processing
Sterling Seismic can quickly and accurately process any zero-offset VSP survey (conventional 3C or DAS) and provide a full suite of useful deliverables to support and enhance your processing and interpretation of any nearby surface seismic data. These deliverables would include a detailed time-depth relationship (i.e. check-shot), an interval velocity profile in time or depth, and a corridor stack giving a primary-only reflectivity profile. Advanced deliverables might also include an analysis of the multiple reflection arrivals present in the section or a depth-dependent attenuation (Q) analysis.
2D/3D Borehole Seismic Image (VSP) Processing
Sterling Seismic has pioneered and patented a unique and extremely successful time-domain approach to 2D and 3D Borehole Seismic Image (VSP) processing. Our process eliminates the difficulties encountered by standard depth-domain 2D and 3D VSP data processing procedures. Most companies attempt to use Pre-Stack Depth Migration (PSDM) to generate a reflection image from 2D or 3D VSP data. While Pre-Stack Depth Migration provides a convenient way to handle the source-receiver geometry of VSP data it imposes the burdensome requirement of determining an extremely precise 3D anisotropic interval-velocity-with-depth field. Determination of a velocity field for 3D VSP or even 2D VSP depth migration is very time consuming, often taking 6-10 months to finalize. This is long after the value of the data could have been maximized for the client, and even after long time delays, the results are often disappointing.
Our time-domain approach eliminates the problems of using only Pre-Stack Depth Migration for 2D and 3D VSP processing. We have developed and patented a wave-equation datuming algorithm based on well-proven wave theory to upward continue data recorded in the borehole to the topographic surface of the earth (Figures 2 and 3). The data transformation from the borehole to the surface requires no knowledge of near-surface statics or of the velocity field. The method only requires use of measured first arrival times that are recorded as a normal part 2D or 3D VSP data acquisition.
Once the wavefield recorded in the borehole has been upward continued to the topographic surface of the earth the data can be treated as surface seismic data. We are then able to process the data as surface seismic data, making use of its well-developed tools, most importantly surface-consistent residual statics and NMO analysis. Thus, we can process even the largest of marine or land 3D VSP datasets in a time frame that is similar to surface seismic datasets.
The 2D and 3D seismic reflection images resulting from application of our method are naturally in the time-domain and overlay surface seismic sections but typically contain two or more times the frequency content of surface seismic data. The resulting images can be converted to depth with an appropriate interval velocity field that can normally be at least partially derived from the VSP data.
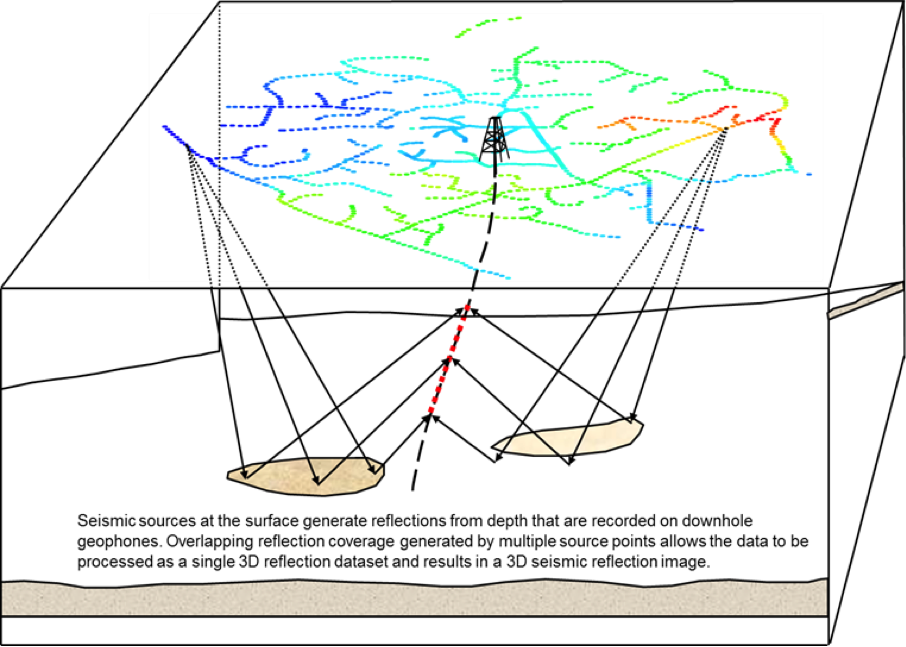
Figure 2: 3D Borehole Seismic Imaging – Possible Acquisition Geometry
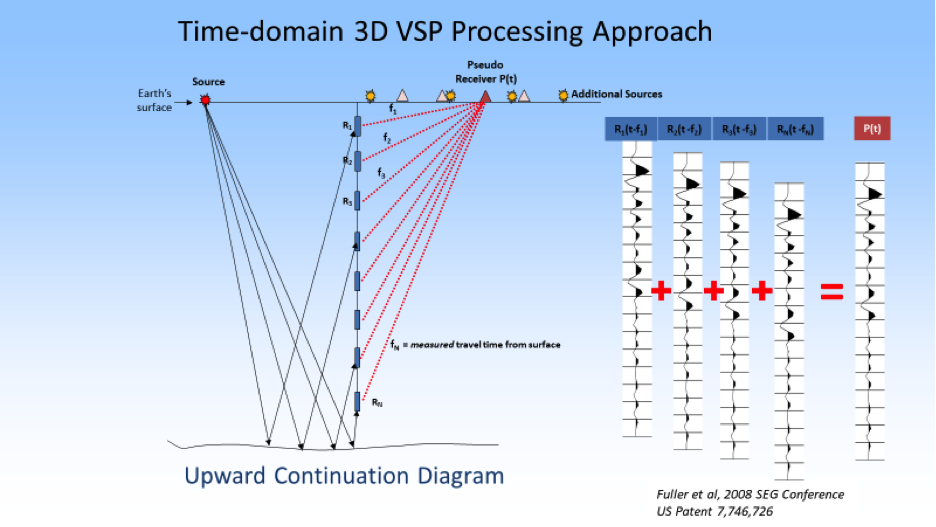
Figure 3:Upward continuation of the wavefield to the earth surface in the time-domain.
2D/3D/4D Borehole Seismic Examples
Michigan 2D VSP
The first example is a walk-away 2D VSP survey designed to help delineate a reef structure in Michigan. The following slides show the comparison of the VSP image to the existing surface seismic, demonstrating the uplift in frequency content and resolution possible when recording data in the borehole and utilizing our advanced processing techniques. The last image shows a comparison between our imaging approach and the original processing, which used conventional PSDM methods.
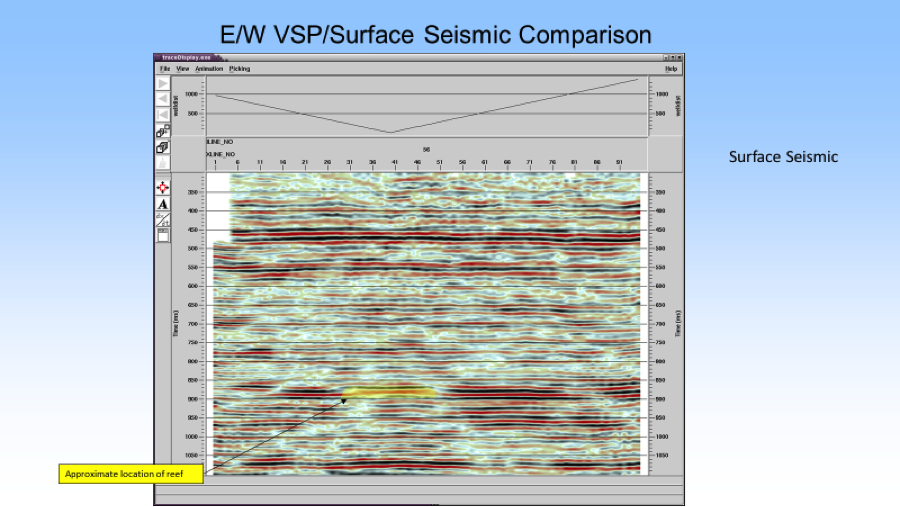
Figure 4:Surface seismic from Michigan example showing approximate location of reef structure.
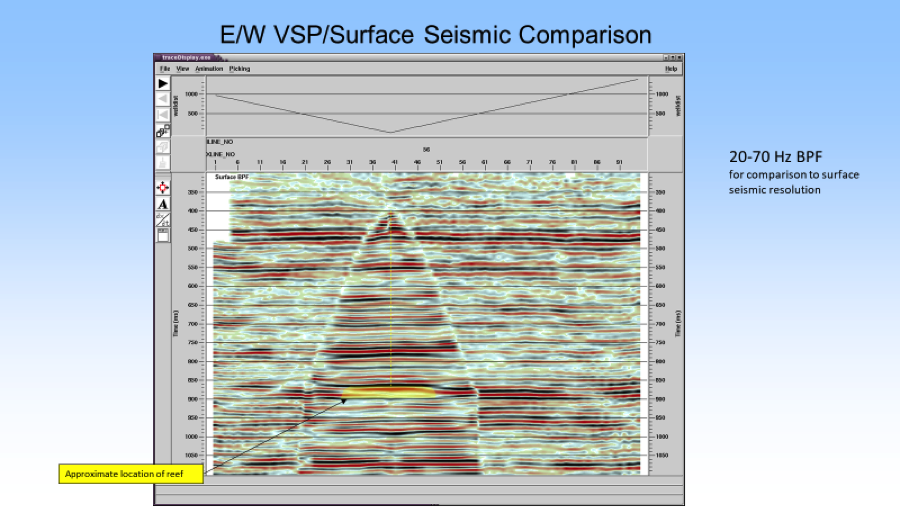
Figure 5:2D VSP image spliced into surface seismic volume filtered at approximately the same frequency band to show the comparison of reflectivity and structure.
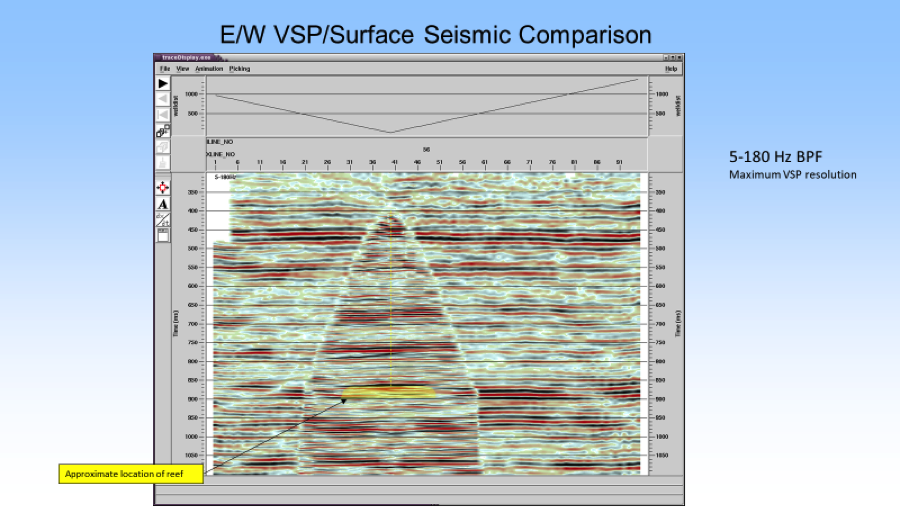
Figure 6:2D VSP image spliced into surface seismic volume filtered to show the maximum resolution available within the data and emphasize the improvement in resolution possible.
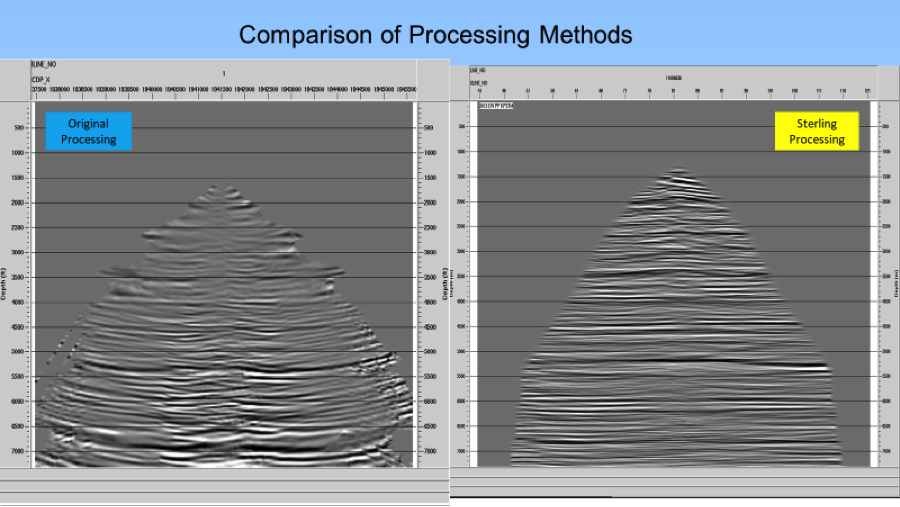
Figure 7:Comparison of 2D VSP images from the original contractor processing and the new image from Sterling Seismic. Note the improved resolution and structure and lack of imaging artifacts.
DAS 3D VSP Survey
The next example shows the results of the conventional VSP processing approach compared with the advanced imaging method used at Sterling. Also included is a comparison to the existing surface seismic data. Note that the majority of the processing and imaging tools developed for 3C geophone data can also be effectively applied to DAS data producing high-resolution images like you see here. Sterling Seismic has also developed some new methods for creating reflection images using the horizontal section of the DAS array (please see the DASeis™ for more information).
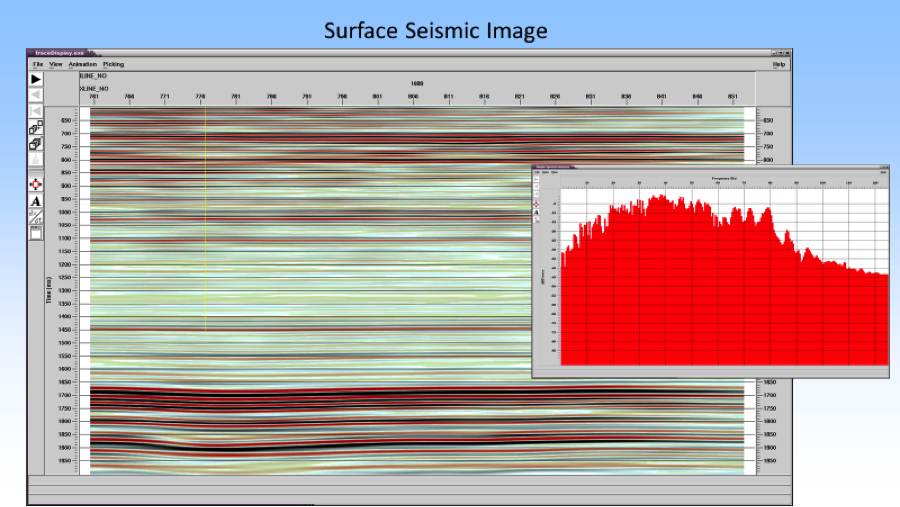
Figure 8:Surface seismic section and the associated average power spectrum.
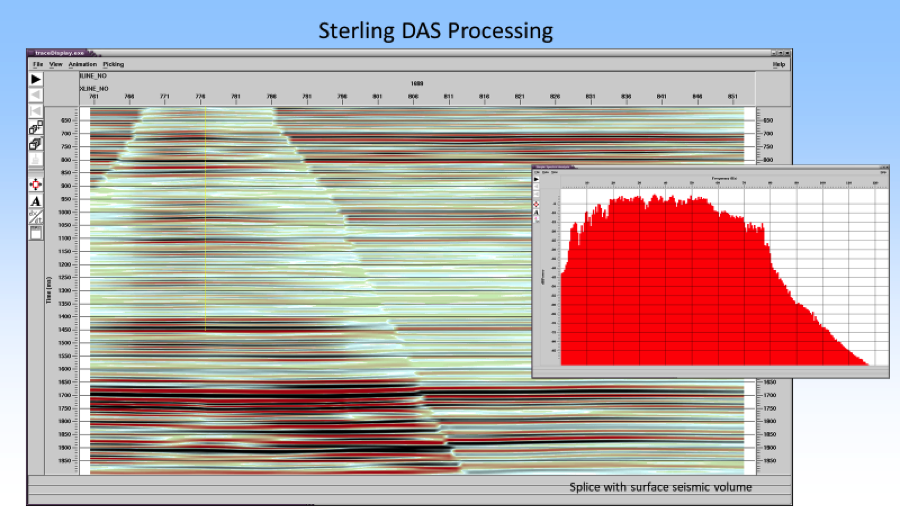
Figure 9:Comparison of the DAS VSP image with the existing surface seismic data. Note the improved frequency content compared to the existing surface seismic (previous figure) and the original processing (next figure).
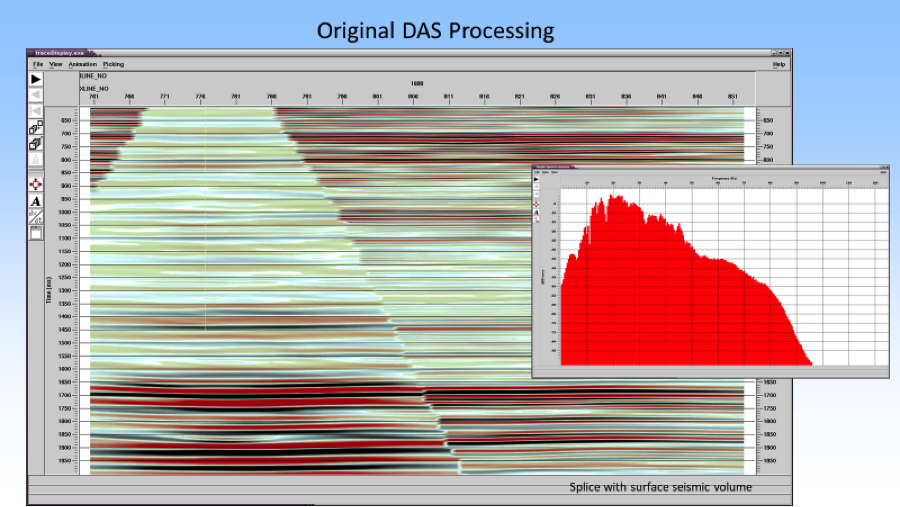
Figure 10:Comparison of the original processing DAS VSP image with the existing surface seismic data. Note the lack of resolution relative to the surface seismic section.
South Texas Time-Lapse 4D VSP Example
The following example shows the results of a 5-survey time-lapse 3D VSP acquired and processed to monitor the injection of CO2 into the producing reservoir. The surveys were designed to be identical duplicates (i.e. same source and borehole geophone locations) but typical changes due to variations in surface conditions over time (e.g. dry versus wet) as well as restricted source access (i.e. changes due to new pipelines and infrastructure) meant that careful attention had to be paid in the processing of the surveys in order to preserve the variations due to CO2 injection at the reservoir while at the same time minimizing variations due to changes in the survey conditions.
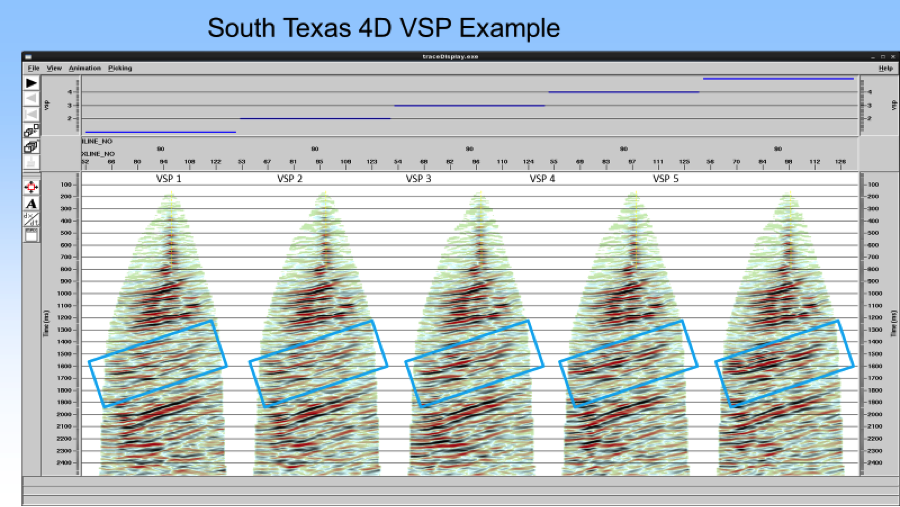
Figure 11:Comparison of 5 episodes of 3D VSP acquisition. Note the change in reflection amplitude within the light blue rectangle indicating a change within the reservoir interval.
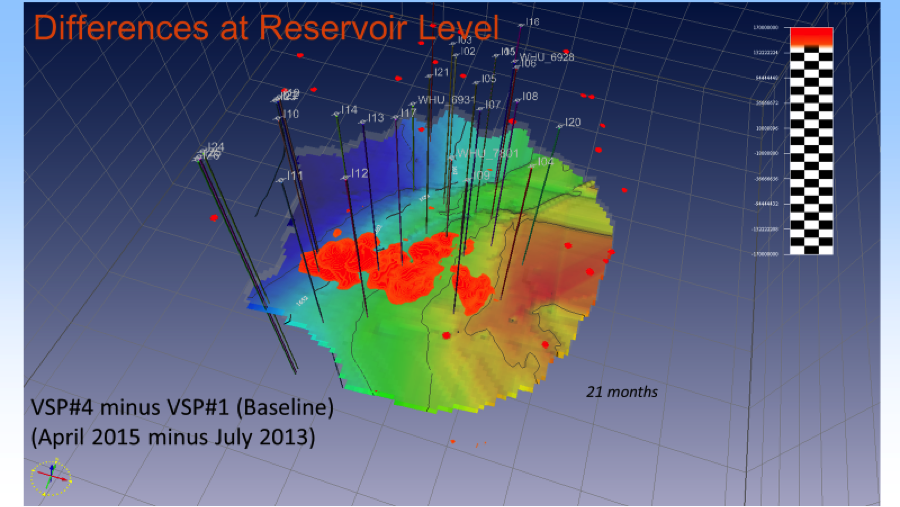
Figure 12:Perspective view of the time-lapse anomalies after 21 months of injection. The colored surface represents a depth horizon at the base of the reservoir zone. The small orange geo-bodies represent the difference in RMS amplitudes after 21 months.
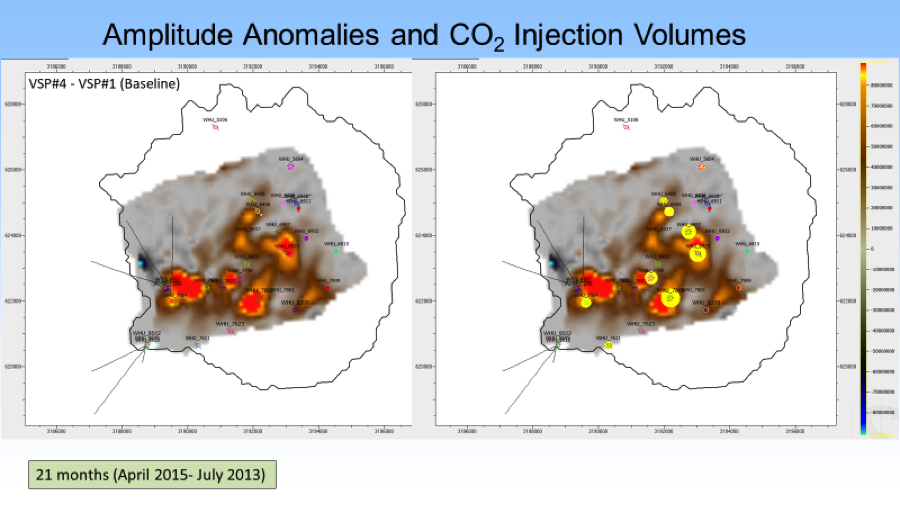
Figure 13:Map view of the time-lapse anomalies after 21 months of injection. The panel on the left shows the amplitude anomalies after 21 months of injection. This is the difference of the RMS amplitudes over the entire reservoir interval. On the right is the exact same image but with the CO2 injection volumes overlaid as colored bubbles. Many of the anomalies can be associated with the CO2 injection volumes but many do not. This should not be a complete surprise since we know that these reservoirs are complex and CO2 movement is not only a function of injection volumes but also production rates and associated water injection.